The Rise of E-commerce in the UK

The Rise of E-commerce in the UK: A 27-Year Journey Through Changing Trends
The Research Data
This blog post examines the evolution of UK retail from 1997 to 2024, utilising data from the annual Fast Track 100 league tables. Each year, the Fast Track 100 ranks Britain’s top 100 private companies with the fastest-growing sales over the latest three years. While the Fast Track 100 data spans various industries—including Construction, Manufacturing, Energy, Travel, Transport, and Services—this analysis focuses specifically on companies in the retail sector. Over the past 27 years, retail has transformed significantly, largely due to the rise of e-commerce, which mirrors broader changes in consumer behaviour, technological advancements, and global events.
The below summary and full tables show you how many companies featured each year in the Fast Track 100 list. Note, in 2021 there was no data recorded due to COVID-19.
Summary Table - 3-year periods - Fast Track 100
| Sub-Industry | 1997-99 | 2000-02 | 2003-05 | 2006-08 | 2009-11 | 2012-2014 | 2015-17 | 2018-2020 | 2022-24 | Total # | Total % |
|---|---|---|---|---|---|---|---|---|---|---|---|
| Fashion & Clothing | 8 | 11 | 4 | 7 | 13 | 16 | 22 | 28 | 27 | 136 | 38% |
| Home & Garden | 3 | 4 | 4 | 2 | 8 | 12 | 6 | 10 | 13 | 62 | 17% |
| Arts & Entertainment | 2 | 2 | 1 | 7 | 10 | 3 | 2 | 7 | 6 | 40 | 11% |
| Health & Beauty | 1 | 1 | 1 | 1 | 1 | 3 | 1 | 10 | 17 | 36 | 10% |
| Sports & Outdoors | 1 | 0 | 0 | 1 | 7 | 8 | 3 | 2 | 10 | 32 | 9% |
| Electricals & Appliances | 4 | 2 | 3 | 5 | 2 | 1 | 4 | 5 | 1 | 27 | 8% |
| Food & Beverages | 0 | 0 | 0 | 5 | 2 | 4 | 2 | 1 | 4 | 18 | 5% |
| Pet Supplies | 1 | 2 | 0 | 0 | 0 | 0 | 0 | 0 | 2 | 5 | 1% |
| Variety Stores | 1 | 0 | 0 | 1 | 2 | 0 | 0 | 0 | 0 | 4 | 1% |
| Grand Total | 21 | 22 | 13 | 29 | 45 | 47 | 40 | 63 | 80 | 360 | 100% |
Full Table - Yearly - Fast Track 100
| Sub-Industry | 1997 | 1998 | 1999 | 2000 | 2001 | 2002 | 2003 | 2004 | 2005 | 2006 | 2007 | 2008 | 2009 | 2010 | 2011 | 2012 | 2013 | 2014 | 2015 | 2016 | 2017 | 2018 | 2019 | 2020 | 2021 | 2022 | 2023 | 2024 | Total # | Total % |
|---|---|---|---|---|---|---|---|---|---|---|---|---|---|---|---|---|---|---|---|---|---|---|---|---|---|---|---|---|---|---|
| Fashion & Clothing | 1 | 3 | 4 | 4 | 5 | 2 | 2 | 2 | 3 | 1 | 3 | 3 | 6 | 4 | 4 | 6 | 6 | 4 | 9 | 9 | 7 | 9 | 12 | N/A | 7 | 11 | 9 | 136 | 38% | |
| Home & Garden | 2 | 1 | 1 | 3 | 1 | 2 | 1 | 1 | 1 | 3 | 2 | 3 | 4 | 5 | 3 | 2 | 2 | 2 | 1 | 2 | 7 | N/A | 6 | 4 | 3 | 62 | 17% | |||
| Arts & Entertainment | 1 | 1 | 1 | 1 | 1 | 4 | 2 | 1 | 3 | 4 | 3 | 1 | 1 | 1 | 1 | 1 | 2 | 2 | 3 | N/A | 3 | 1 | 2 | 40 | 11% | |||||
| Health & Beauty | 1 | 1 | 1 | 1 | 1 | 2 | 1 | 1 | 4 | 4 | 2 | N/A | 3 | 5 | 9 | 36 | 10% | |||||||||||||
| Sports & Outdoors | 1 | 1 | 3 | 4 | 3 | 1 | 4 | 1 | 1 | 1 | 1 | 1 | N/A | 3 | 3 | 4 | 32 | 9% | ||||||||||||
| Electricals & Appliances | 1 | 1 | 2 | 2 | 1 | 2 | 2 | 2 | 1 | 1 | 1 | 1 | 2 | 2 | 2 | 1 | 2 | N/A | 1 | 27 | 8% | |||||||||
| Food & Beverage | 1 | 2 | 2 | 1 | 1 | 2 | 2 | 1 | 1 | 1 | N/A | 3 | 1 | 18 | 5% | |||||||||||||||
| Pet Supplies | 1 | 1 | 1 | N/A | 1 | 1 | 5 | 1% | ||||||||||||||||||||||
| Variety Store | 1 | 1 | 1 | 1 | N/A | 4 | 1% | |||||||||||||||||||||||
| Grand Total | 5 | 6 | 10 | 8 | 8 | 6 | 3 | 4 | 6 | 13 | 8 | 8 | 11 | 17 | 17 | 14 | 15 | 18 | 10 | 15 | 15 | 16 | 19 | 28 | N/A | 27 | 25 | 28 | 360 | 100% |
Overall Growth in UK’s Fastest-Growing Companies
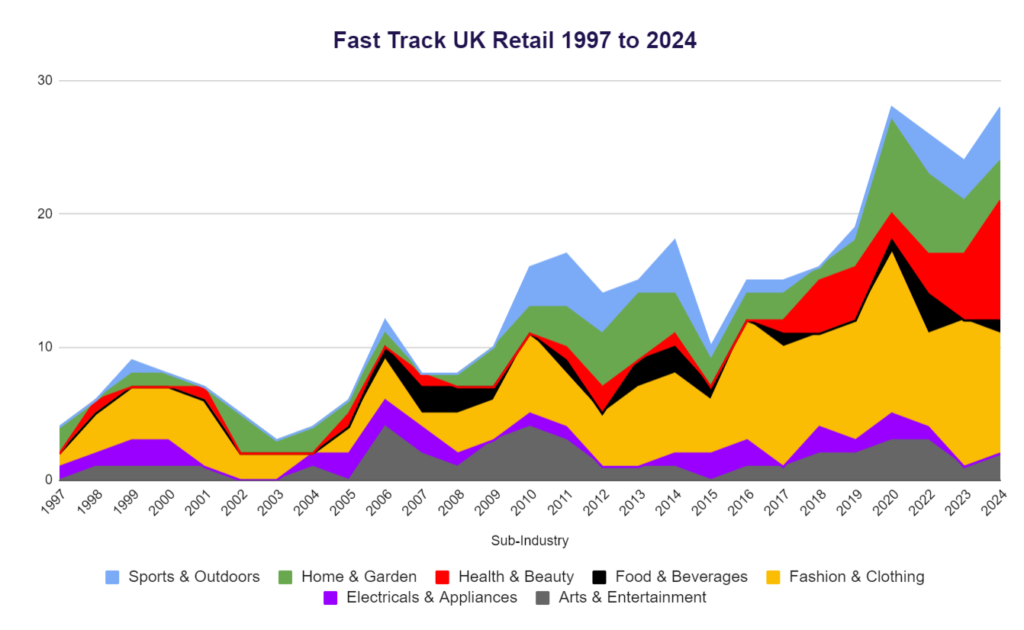
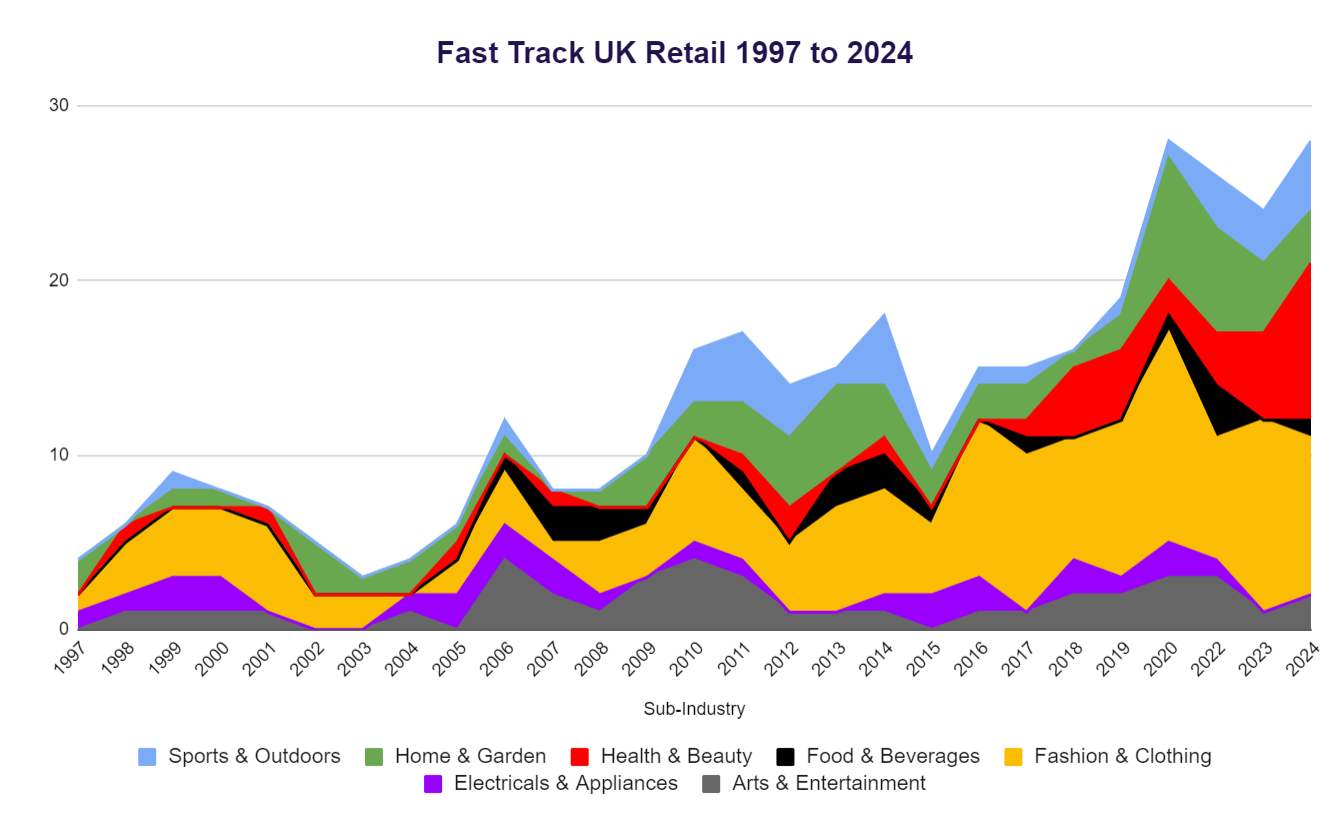
The total number of retail companies featuring in the top 100 fastest-growing list has seen a notable increase, from 5 in 1997 to 28 in 2024 (see full table and the stacked line graph above). This growth has been driven by online e-commerce adoption, with the “Fashion & Clothing” and “Health & Beauty” sub-categories leading this trend, each featuring 9 companies out of the 28 retailers in 2024. Another key trend is that in recent years both “Home & Garden” and “Sports & Outdoors” companies have seen performance increases as a result of COVID and post-COVID consumer behaviour changes.
1997-2024, number of companies in each sub-industry that featured in the Fast Track 100:
- Fashion & Clothing: 136 companies > 38%
- Home & Garden: 62 companies > 17%
- Arts & Entertainment: 40 companies > 11%
- Health & Beauty: 36 companies > 10%
- Sports & Outdoors: 32 companies > 9%
- Electricals & Appliances: 27 companies > 8%
- Food & Beverages: 18 companies > 5%
- Pet Supplies: 5 companies > 1%
- Variety Stores: 4 companies >1%
Note: if you click the links it will take you to a page so you can see the top companies in each sub-category.
In 2024, the e-commerce sub-industry breakdown was:
- Fashion & Clothing: 9 companies
- Health & Beauty: 9 companies
- Sports & Outdoors: 4 companies
- Home & Garden: 3 companies
- Arts & Entertainment: 2 companies
- Food & Beverages: 1 company
- Electricals & Appliances: 0 companies
- Pet Supplies: 0 companies
- Variety Stores: 0 companies
Fashion & Clothing: Leading the Charge
The Fashion & Clothing sub-industry has emerged as a dominant force in the UK’s e-commerce landscape. From one company (Boden) in 1997 to 12 (Lounge Underwear, Astrid & Miyu, RIXO, Oh Polly, Gymshark, Bluebella, Saloni, BrandAlley, ME+EM, Manière De Voir, Fairfax & Favor, Estella Bartlett) in 2020, culminating in a total of 136 companies over the 27-year period.
Fashion & Clothing: Key Drivers of Growth:
- Fast Fashion and Online Retailers: Brands like Net-a-Porter, Missguided, and Gymshark have revolutionised the market with trendy, affordable clothing and rapid delivery options.
- Technological Advancements: Improved websites, mobile apps, and virtual try-ons have enhanced the online shopping experience.
- Social Media Influence: Platforms like Instagram and TikTok, alongside influencers, play a crucial role in driving fashion trends and sales.
- Sustainability Trends: An increasing consumer focus on sustainable and ethical fashion has led to the rise of eco-friendly brands and circular fashion models.
- Pandemic Impact: The COVID-19 pandemic accelerated the shift to online shopping, with consumers opting for the convenience and safety of e-commerce.
Fashion & Clothing Sub-Sectors:
- Clothing brand/retailer: 63.2%
- Jewellery retailer: 9.6%
- Underwear brand/retailer: 5.9%
- Watch retailer: 4.4%
- Footwear and accessories retailer: 4.4%
- Others: 12.5%
Health & Beauty: A Surge in Recent Years
The Health & Beauty sub-industry has shown remarkable growth, particularly in the last decade. Starting with only 1 company in 1997-1999, the sector grew to feature 17 companies in 2022-2024, with a total of 36 companies over the entire period.
Health & Beauty: Key Drivers of Growth
- Rising Consumer Interest in Wellness: Increasing awareness of personal care and wellness has driven demand for health and beauty products.
- Innovation and Product Diversification: The introduction of niche products, organic and natural cosmetics, and personalised skincare solutions has broadened the market.
- E-commerce Convenience: The ease of purchasing health and beauty products online, combined with the availability of reviews and comparisons, has made e-commerce an attractive option.
- Social Media and Influencers: Influencers and beauty bloggers significantly impact consumer purchasing decisions through tutorials, product reviews, and endorsements.
- Pandemic Impact: The pandemic heightened the focus on self-care and hygiene, driving online sales of health and beauty products.
Health & Beauty Sub-Sectors:
- Beauty products retailer: 47.2%
- Hair Care brand: 11.1%
- Drinks and supplements brand: 11.1%
- Others: 30.6%
Other Sub-Industry Trends
1. Home & Garden
Demonstrated substantial growth from 2009-2011 onwards, with a total of 62 companies. This reflects an increasing consumer focus on home improvement and gardening, particularly during the pandemic. Key Sub-Sectors: Furniture retailer (37.1%), Bathroom retailer (17.7%), Flooring retailer (12.9%). Full results.
2. Arts & Entertainment
Volatile growth with significant peaks during 2009-2011 and 2018-2020, totalling 40 companies. Notably names from 2009-2011 include: Moonpig.com, The Book Depository, Notonthehighstreet.com, MenKind and Getting Personal. Key Sub-Sectors: Gift retailer (25%), Merchandise retailer (17.5%), Greeting card retailer (15%). Full results.
3. Sports & Outdoors
UK sports saw growth from 2010 to 2014 buoyed by health drives and the London Olympics. Of particular note was the cycling industry growth of companies such as Wiggle, Chain Reaction Cycles, and Rapha. More recently, COVID and post-COVID trends have seen a rise in consumer demand for Sports & Outdoors activities. This is reflected in the Fast Track 100 results where in 2024, four companies featured: Passenger, Castore, ThruDark, and AYBL Group. Key Sub-Sectors: Cycling retailer (28.1%), Outdoor retailer (21.9%), Sportswear brand (15.6%). Full results.
4. Electricals & Appliances
While initially strong, this sector has seen less consistent growth in recent years, indicating possible market saturation or shifts in consumer priorities. Mobile phone retailers featured in the top 100 companies between 1997 and 2016, such as Carphone Warehouse, The Mobile Phone Store, Buymobilephones.net and Mobile Phones Direct. In terms of Appliances, AO.com were in the top 100 for two years 2007 and 2008. Key Sub-Sectors: Mobile phone retailer (33.3%), Electronics retailer (14.8%), Lighting retailer (11.1%). Full results.
5. Food & Beverages
A latecomer to the list, this sector began to feature in 2006-2008 and has shown modest growth in numbers since, totalling 18 companies. However, some major companies feature in this sub-category with huge sales growth individually, for instance Graze, Huel and Naked Wines. Key Sub-Sectors: Organic produce retailer (22.2%), Food retailer (22.2%), Wine retailer (11.1%). Full results.
6. Pet Supplies
Two pet companies have featured: Pets at Home and Pets Purest. Full results.
7. Variety Stores
Poundland, 99p Stores, and B&M Retail have featured in the Fast Track 100 list during the early 2000s with growth of consumer footfall into discount stores. Full results.
Conclusion
The UK’s e-commerce sector has undergone significant transformation over the past 27 years. The Fast Track 100 data highlights the rapid rise of the Fashion & Clothing and Health & Beauty sub-industries, driven by changing consumer behaviours, technological advancements, and the impact of global events such as the COVID-19 pandemic. These trends underscore the dynamic nature of the market and the importance of innovation and adaptability for businesses aiming to stay ahead in the competitive e-commerce landscape.
As we look to the future, it will be interesting to see how these sub-industries continue to evolve and which new sectors emerge as leaders in the UK’s fastest-growing company lists.
Quick Links to each E-commerce Fast Track 100 Report

Britain's fastest growing private companies from 1997-2024
What is the Fast Track 100?
The Fast Track 100 league table ranked Britain’s 100 private companies with the fastest-growing sales over their latest three years. It is compiled by Fast Track and published in The Sunday Times each December. It ran from 1997 to 2020, until 30th June 2021 when the Fast Track company was closed down due to the Covid-19 pandemic causing too much uncertainty over continued sponsorship.
In 2022, The Sunday Times announced it was restarted the Fast Track 100. It is branded as – The Sunday Times Hundred 2022.
A typical Fast Track 100 company:
- is owned and run by entrepreneurs
- has between 20 and 500 staff
- has average 3 year sales growth ranging between 45% and 250% pa
- has sales ranging between £5m and £100m
- 25% of the companies have venture capital backing
Book your FREE strategy session!
On your free phone consultation, one of our experts will discuss the following:
- Your business, your goals and what success means to you
- How our approach to digital advertising will achieve your goals
- Whether we're a good fit for one another (we certainly hope so)
There’ll be no commitment or obligation to use our services.


